
L![]() ike most science teachers, I begin the year with a review of the scientific method and process skills involved in science. To accomplish this, I use a Product Claim Project to allow students the chance to work through all parts of the scientific method and to apply their process skills. Student get to practice their measurement, data collection, data analysis, using computational thinking, arguments from evidence and more… In short, I give them the chance to “do science.”
ike most science teachers, I begin the year with a review of the scientific method and process skills involved in science. To accomplish this, I use a Product Claim Project to allow students the chance to work through all parts of the scientific method and to apply their process skills. Student get to practice their measurement, data collection, data analysis, using computational thinking, arguments from evidence and more… In short, I give them the chance to “do science.”
Instead of waiting until the end of the unit to complete the project as a culminating activity, parts of this project are spiralled into the unit over many weeks. It can be difficult to maintain the momentum over several weeks, but the time also allows the students to do some ideas that might be impossible with a short production cycle. The time also allows me many opportunities to check for student understanding with assignments and Google form exit slips.
Determine the Claim

Each student is asked to find one product that they are interested in and then determine what the product claims it can do. Determining the claim can be very difficult for some students as they are often more interested in the product itself and the marketing surrounding it, than they are in what the product actually claims to do. For example, many sport drinks never actually claim that your performance will improve but rather just use the suggestion that people who do drink them are very good athletes (i.e. correlation vs causation).
This step has required me to spend time helping my students better understand quantitative and qualitative data. I provide the students a few examples and then they have to complete several formative assessments to ensure everyone can break down a claim into something that can be measured. Now we move on to writing testable questions about the claim.
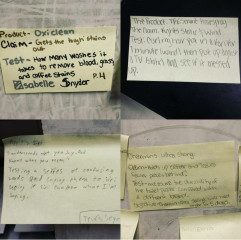
Each student is asked to write on Post It notes explaining the product you have chosen to test and other key details like:
- What is the product that you will test?
- What claim does the product make?
- How will you test if the claim is valid or not valid?
- What quantifiable data will you collect?
 This step helps them summarize their ideas as there is not much room on a Post It note. I can also arrange the notes then into similar test groups. This is where students form the testing groups of one to four students. I allow students to pick their own groups on this project and limit the maximum number to 4. There are a few rare occasions I will need to make “group suggestions” but overall, kids are good at self-selecting people they can work well with.
Develop a testing procedure to check the claim
Once I have created student interest groups, the students begin working on their testing procedure. I provide examples as well as several scaffolding activities that help them write a good procedure. One of my favorite is to give each group a bag of about 20 random legos. They then need to build something while writing the steps out into a procedure. The group then disassembles the legos and puts them back into the bag with the instructions. The “winning” group is the first to get their lego object rebuilt by another group.
Collect data as Evidence
The testing days are among the most fun for me and my students. I do several measurement and lab skills “tune-up” activities leading up to the product claim testing days. This includes a few lessons on precision and accuracy. Some tests are run at home and some are completed before/after school. It is fun to watch students help with others experiments. Many are interested in what others are doing and many use other students as test subjects if their claim requires it.


")
Analyze the data to determine if it supports/does not support the claim.
 Data analysis revolves about graphing. Students are encouraged to ask “what does this data show” or “not show.” “Does this data support or not support the product claims?” They must construct an explanation (Reasoning) to describe the results. This data must loop back to their original claim and provide evidence that supports this explanation. This structure is supported in all classes with the RACE model. I find it helpful to insist students color code their summary RACE paragraph. It helps them reflect on each component of the RACE model and helps me check for understanding.
Share/Communicate findings with others.
The final step is a share presentation with the class summarizing their findings. The share is up to the individual group but most pick to do a short multimedia presentation (i.e. Powerpoint, Google Slides) or create a poster. These are the formats most seem to feel most comfortable at this point in the year. If I were to do this later in the year, I expect more would pick a video option but this early in the school year, it seems many students are still anxious about their skills at creating a video for a grade.
From beginning to end, this entire process is about 6 weeks of instruction. We typically spend about two days per week with the Product Claim Project as the focus while the other days are scaffolding instruction or activities that will later be applied to their claim. I have found this helps kids see the meaning in what we are doing in class. It also helps them stay engaged as they are researching, testing, analyzing, and sharing data on a product they have selected. This student generated focus will again be applied later in the year when we begin a 20% Time Project (AKA Genius Hour). More of that in a later post…
